®


HRMISolutions Ltd


These charts show our fictitious organisation's progress in meeting its key performance indicators (KPIs).
The organisations main people management KPIs are around:
The charts show progress based on the previous one year period. When we look over a time period rather than a snapshot in time we begin to be able to predict future progress. In essence we begin to be able to state where we are now and because we are looking at a significant period we can analyse why things happened and predict what is likely to happen next.
This is the first section of the site that uses HR formulae. Examples are
If nothing else is learned here please remember to always obtain a firm definition of what is required and always give a firm explanation of what has been provided.
It is important that anyone dealing with HR dashboards or statistical information is able to clearly define what they are presenting and how the information has been derived. This means that in order to create a dashboard there must be detailed discussions on what is to be monitored and analysed. No one is too important to be specific about what they want. In analytics there is no room for vague statements of requirements or language that trails off into a ambiguous phrases like 'you know what I mean...', '...that kind of stuff', '...that kind of thing etc' , 'just give me details of all staff'. When you scratch the surface each of those statements are likely to give different interpretations.
Even at the most basic level there needs to be some agreement on what is truly meant by for example 'all staff'. It is quite possible that a person that says this does not truly mean everyone working for the organisation, they may actually just mean only persons directly employed under contracts of employment (employees). Imagine though if they also meant all contractors, sub-contractors, consultants, agency workers and people who had received payments for one off pieces of work. Take a moment here and think about how much of that cannot actually be answered by an HR information office and why it is important to be assertive enough to clarify a requirement before providing information.
There is also a duty for HR information specialists to accurately define what they have produced. We cannot stress enough the hurt, embarrassment and loss of trust that can arise from leaving someone to interpret information wrongly in an important meeting. A simplistic example could be saying our short term sickness is X and leaving the person to believe that short term relates to anything that is a week or less when the actual definition is less than 28 days.
For an introduction to HR information the technical side to making dashboards is a bit heavy going. So what we will do here is take a quick look at perceptions and how people see things. There are no wrong or right answers. All that is important is to take away the understanding that even in a group who have worked together for years it is possible for people to look at the same thing and see it differently. This is why we advise that HR information specialists should always be sufficiently skilled with their tools to provide a blended way of delivering information.
For a light hearted but important way of looking at the ways people perceive things please visit our page titled Perceptions.
The Employment Rights Act 1996 underpins contracts of employment in the United Kingdom.
The terminolgy to use is a written statement of particulars of employment. This summarises the main particulars of the employment relationship and must according to the legislation be given within two months of the person's first day of service.
Whilst the law states two months it would actually be poor form to encourage a person to give up an existing job or prior state of affairs without actually presenting them with the contractual terms of their new role until two months after it has started. The law is quite flexible but if we are truly focused on the quality of the engagement with the prospective member of staff the written statement of particulars really should be issued as soon as possible after the decision to appoint has been made.
Issuing the written statement of particulars at the earliest point means the person is aware of what they being contracted to and can clarify any uncertainties before accepting. Starting a relationship in this manner where possible helps ensure a more harmonious contract.
The key aspects of a written statement of particulars are as follows:
An explanation of the symbols used

|
This icon represents a unit that has child units. Click it to see the child units. |

|
This icon means that a unit has its child units visible. Click to close the child units. |
| Unit name | Click on a unit to get more information on it. If the unit has child units it will open a page showing them too. |

|
Clicking this icon takes you to some basic theory on organisation charts and structure. |

|
This button is Collapse All and when clicked closes all units that have been opened up. |

|
This button is Expand All and when clicked opens all units so you will see every aspect of the tree. |

Dashboards can be used to show an organisation's progress in relation to achieving its key indicators of performance. We have created a scenario where details are reviewed in terms of our fictional university's progress over the past 12 months.
In the fictional University of Small Bites we have identified the following as key performance indicators (KPIs)
A key thing we believe you will see is that data encourages further more detailed data in order to help make informed decisions about what is likely to happen next. We have used bar charts to help graphically display the dashboard data. What we have displayed is close to the most basic level of information possible.
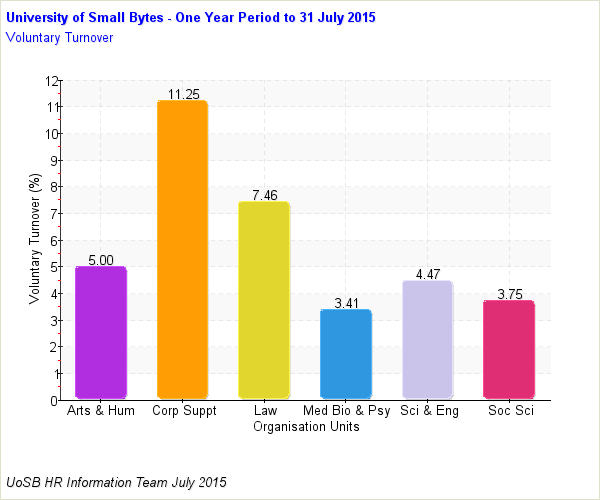
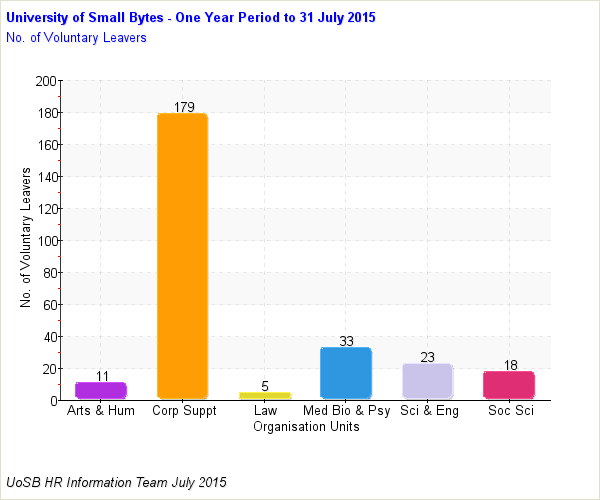
Voluntary Turnover is a percentage that measures the rate at which employees voluntarily choose to leave an organisation within a given period. In order to measure this it is crucial that reasons for leaving are captured for all staff and the voluntary reasons for leaving must be clearly categorised.
Different services will have different ideal turnover levels. Voluntary turnover is a measure of employee satisfaction. If it is too high then perhaps there is dissatisfaction.
if A is the Total number of voluntary leavers over a period and
B is the Average total number employed over the period then
Formula for voluntary turnover for the period is A/B *100
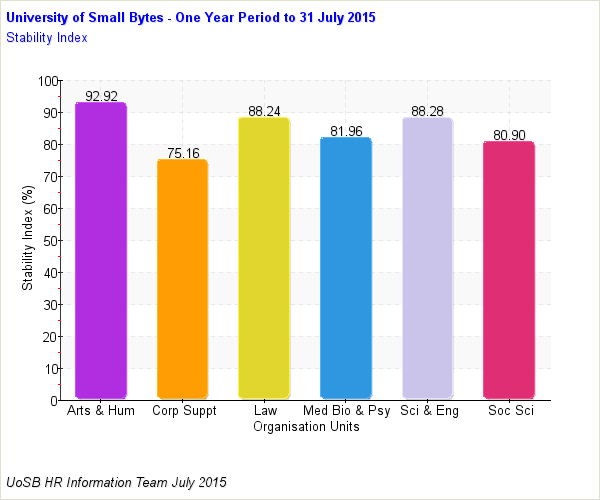
A stability index is a percentage that indicates the retention rate of experienced employees. It is normally measured over a period in time. Normally the higher the index the better. It is possible however for a service to stabilise to the degree that very few new employees join. This can be valuable in terms of knowledge retention and loyalty but could leave the service with the challenge of ensuring that it remains open to new ideas.
if A is the Number of staff with service of one year or more and
B is the Total number of staff in post at the start of the reportng period then
Formula for the stability index for the period is A/B *100
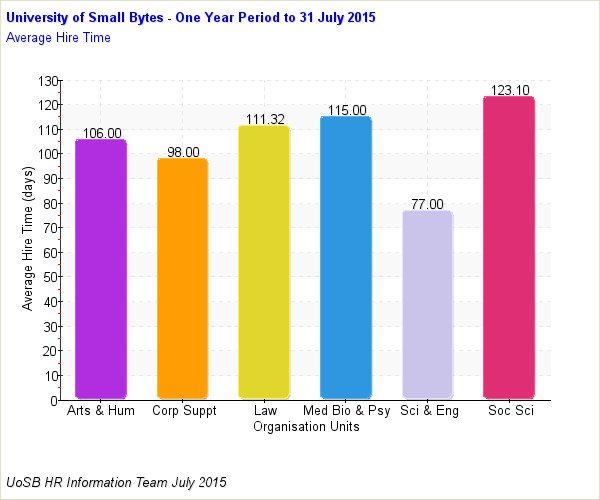
The average time to fill a vacant position can be used to assess the efficiency of the recruitment process and is indicative of the cost of replacing staff. When drilled into and broken down by staff group it can give an indication of the cost of replacing staff. The shorter the average hire time the better.
Hire Time is an average.
If Ai=number of days to fill a position A then
if there are n positions in the reporting period
Formula is therefore (A1+A2...+An)/n
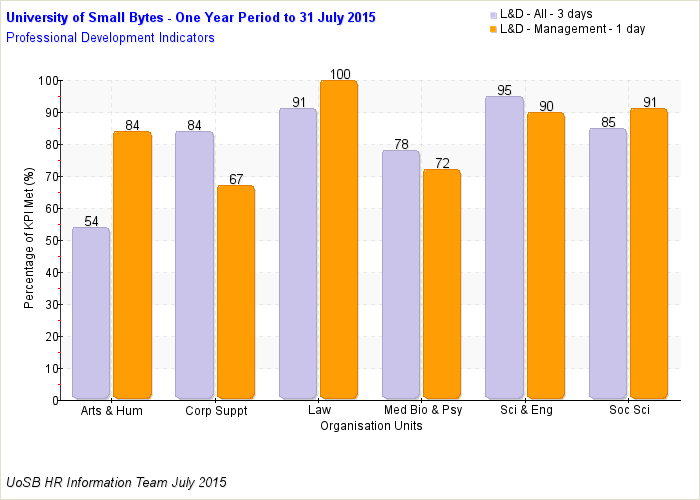
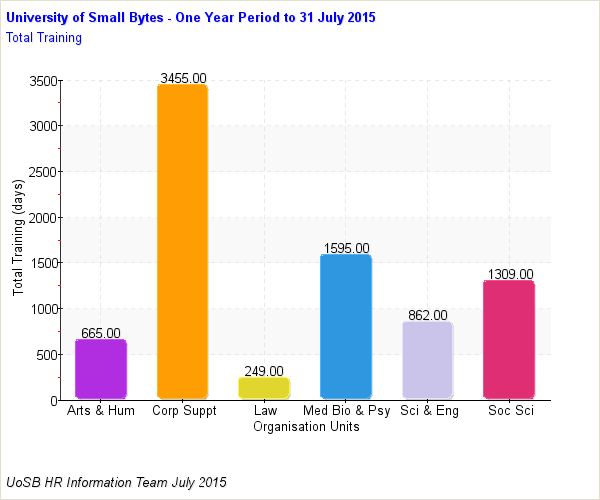
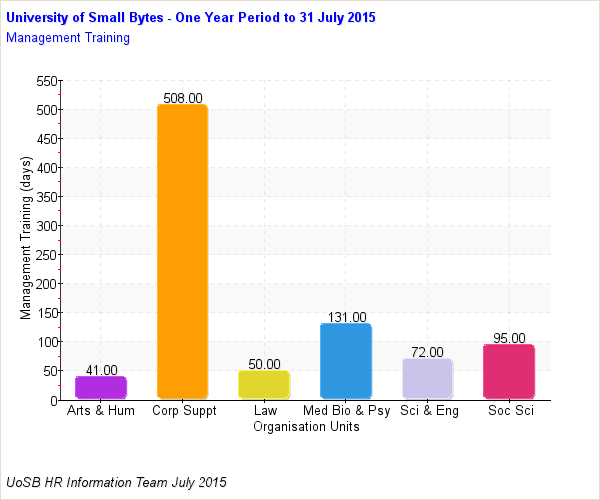
There are differing professional body rules on the amount of continuous professional development that professionals should have. In order to develop and sustain a learning culture this organisation would like all staff to benefit from at least three days of learning per annum and for all managers at least one day of that professional development should be Management and Leadership training.
The number of grievances launched within a given period can be an indicator of staff dissatisfaction. The lower the number the better some might say. It is possible for services to to see the resolution of complaints as healthy. It is complex to set a performance indicator for grievances based purely on numbers as there is the very real danger of creating a culture where dissatisfaction is driven underground.
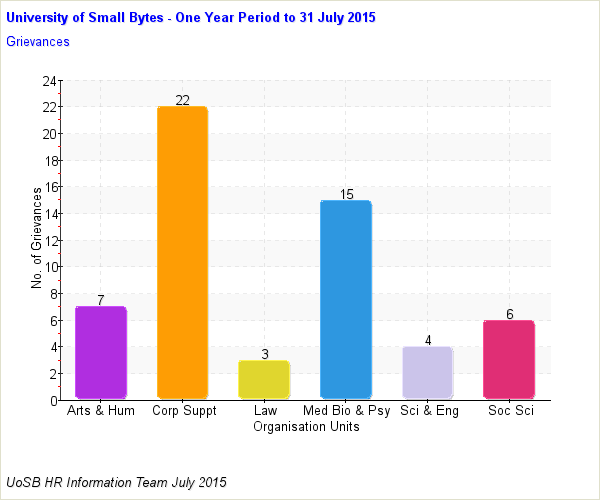
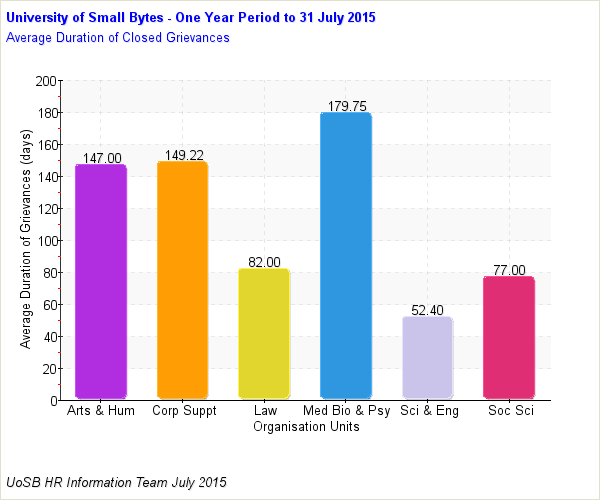
Irrespective of how grievances and discussions about differences are perceived and categorised it is important that issues are resolved in a timely fashion.
If Ai=number of days to resolve grievance A then
if there are n grievances in the reporting period then
the average duration of grievances completed in a period is calculated as below:
Formula is (A1+A2...+An)/n
Disciplinary actions are corrective but also can be indicative of where the employment relationship is failing. Keeping an awareness of disciplinary proceedings allows service heads to understand where issues are arising and identify what corrective measures can be put in place to help reduce the incidences of conduct issues in future.
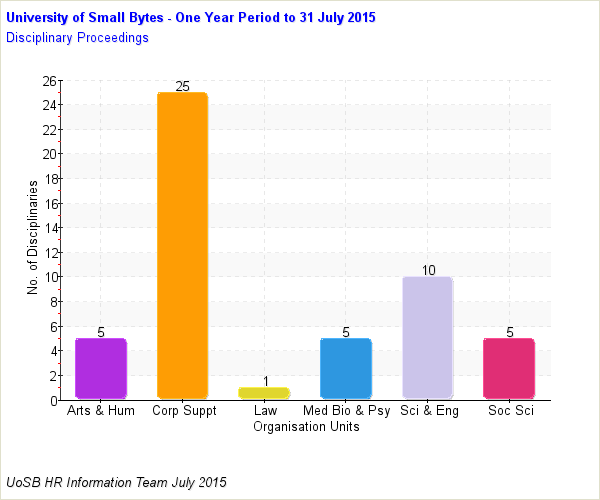
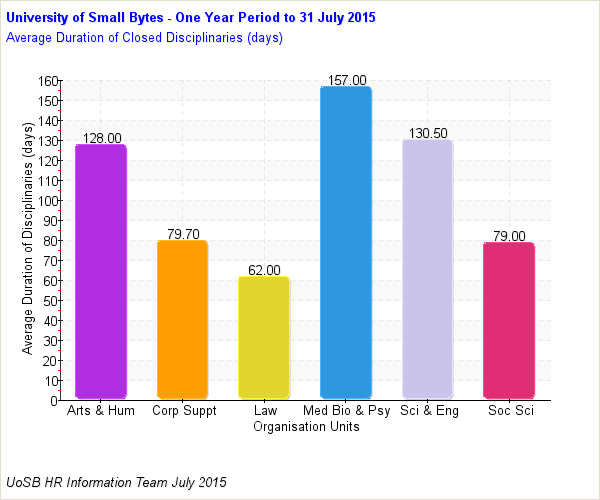
Disciplinary matters should not be allowed to drag on. Performance and morale is likely to suffer while proceedings take place. It is imperative that all disciplinary proceedings are regularly reviewed. The time taken to deal with issues thoroughly is an important indicator of performance.
If Ai=number of days to resolve a disciplinary matter A then
if there are n disciplinary matters in the reporting period then
the average duration of disciplinary matters completed in a period is calculated as below:
Formula is (A1+A2...+An)/n
The annual cost of sickness absence has climbed to almost £29 billion for UK organisations, according to 2013 figures from the consultancy company PwC. The average number of days sickness per employee varies across organisations and sectors. In some sectors amongst some staff groups it even seems to be custom and practice not to report at all.
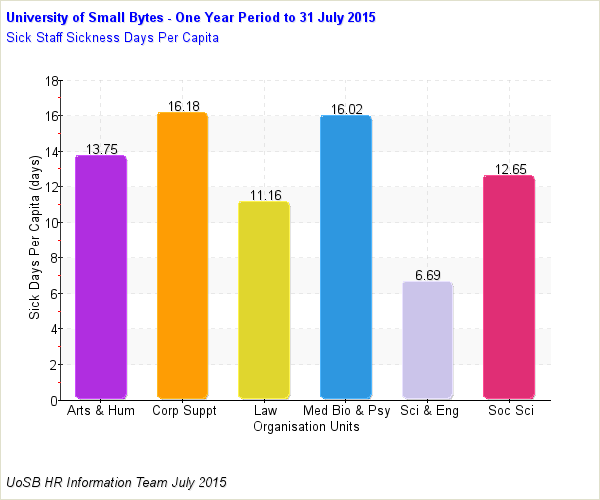
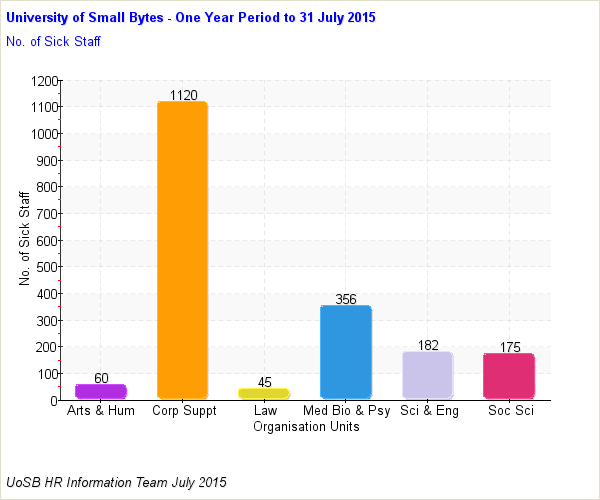
In this fictitious organisation sickness indicators are measured on the average days of sickness absence taken by those staff who have been sick during the reporting period. This could make the average higher than normal as the organisation is focusing on staff who have been unwell rather than everyone employed.
This measure is good when descending or low. Sickness days per capita is a useful measure of the organisation’s health and ability to deal with sickness absence. Care must be taken to manage disability related sickness with appropriate sensitivity.
If Ai=number of sickness absence days person A has had during a reporting period then
if there are n different people who have been unwell in the reporting period then
the average duration of sickness per capita during the period is calculated as below:
Formula is (A1+A2...+An)/n
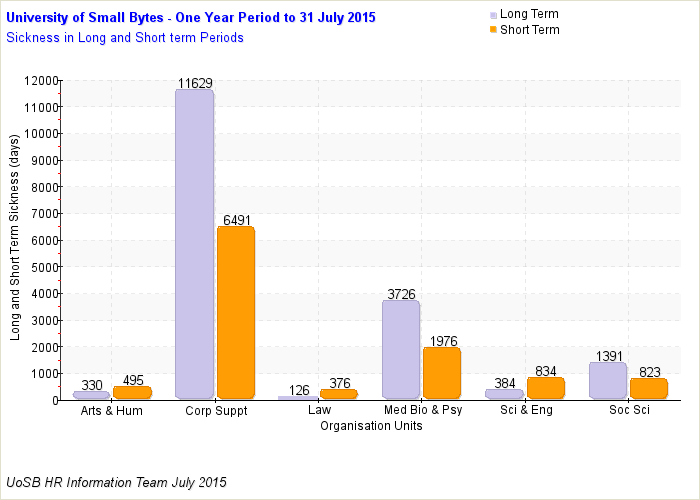
When dealing with sickness matters it is useful to be able to separate out long term sickness from incidences of short term sickness. In this fictitious organisation we have decided that long term sickness is anything over four weeks i.e. >28 days
This measure is good when descending or low. It is a useful measure of the organisation’s health and ability to deal with sickness absence. Care must be taken to manage disability related sickness with appropriate sensitivity.