®


HRMISolutions Ltd


People working in HR information roles will know that there are a variety of reports that are required throughout the year. Many of those can be variations on themes about the organisation's staff profile.
An approach to dealing with the volume of reporting is to identify a set of questions that are regularly asked and publish those profiles periodically throughout the year. These can be described as profiles of the organisation at a point in time.
There can be a few benefits to publishing point in time profiles online:
Profiling is much more complex than just putting together a few reports like the ones below. Setting up a template of what is required and then programming your computer to draw the charts at a particular point in time involves initial effort then thereafter it can be a maintenance task to run the reports each period. When determining what to put into point in time reports it is a decent idea to first look at legislation and best practice guidance to see what information there is a duty to produce.
An example of some requirements in Europe can be found in the European Commission Legislation and Equality Plans guidance.
With a basic HR system it is reasonably straightforward to categorise staff by one or more staff groups.
With an intergrated HR/payroll system it is possible to create accurate profiles based on pay.
Once the legislative requirements have been addressed, it is a good idea to see what information departmental colleagues need for business planning, external reporting and bid preparation. It is likely that the same type of information is needed across departments and as such it should be relatively straightforward to produce a set of profiles for departments to use.
In the UK a benefit from the above approach can arise when dealing with some Freedom of Information Act requests.
The best advice we can think of is create a table of data on the point in time date that holds all of the information that will feed the profile charts.
We suggest this simply because in large organisations live data will continue to change for a variety of legitimate reasons:
The Employment Rights Act 1996 underpins contracts of employment in the United Kingdom.
The terminolgy to use is a written statement of particulars of employment. This summarises the main particulars of the employment relationship and must according to the legislation be given within two months of the person's first day of service.
Whilst the law states two months it would actually be poor form to encourage a person to give up an existing job or prior state of affairs without actually presenting them with the contractual terms of their new role until two months after it has started. The law is quite flexible but if we are truly focused on the quality of the engagement with the prospective member of staff the written statement of particulars really should be issued as soon as possible after the decision to appoint has been made.
Issuing the written statement of particulars at the earliest point means the person is aware of what they being contracted to and can clarify any uncertainties before accepting. Starting a relationship in this manner where possible helps ensure a more harmonious contract.
The key aspects of a written statement of particulars are as follows:
An explanation of the symbols used

|
This icon represents a unit that has child units. Click it to see the child units. |

|
This icon means that a unit has its child units visible. Click to close the child units. |
| Unit name | Click on a unit to get more information on it. If the unit has child units it will open a page showing them too. |

|
Clicking this icon takes you to some basic theory on organisation charts and structure. |

|
This button is Collapse All and when clicked closes all units that have been opened up. |

|
This button is Expand All and when clicked opens all units so you will see every aspect of the tree. |

What we have below is a rather simplistic example of how some basic information can be displayed on our fictional organisation the University of Small Bites. You will notice we have only shown some information on average pay and age bands profiled by sex. The data in relational databases is such that the information which can be aggregated is quite vast. This can then be sliced into all manner of more granular detail.
An ideal is to try to deliver information in a manner that can be accessed using hand held devices whenever users need it.
In HR information offices a huge amount of time can be saved if we determine what the organisation needs on a regular basis. This information can then be placed online at specific points in the year for colleagues to use. We call these Point in Time reports. It is also a good idea to ensure that charts can be easily saved by users for use in documents of their own.
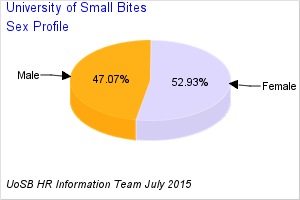
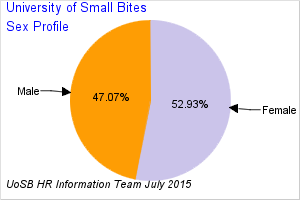
University of Small Bites
Sex Profile
| Female | 2039 | 52.93% |
| Male | 1813 | 47.07% |
| Sum: | 3852 | 100% |
A very frustrating thing about the distribution of salaries in this fictitious organisation is the age old upsetting thing of pay not being equal across the sexes. Because this is a fictitious organisation this pay discrepancy can easily be corrected. In real life however it is significantly more difficult to deal with. The thing about transparent information is it helps shine a light on inequity.
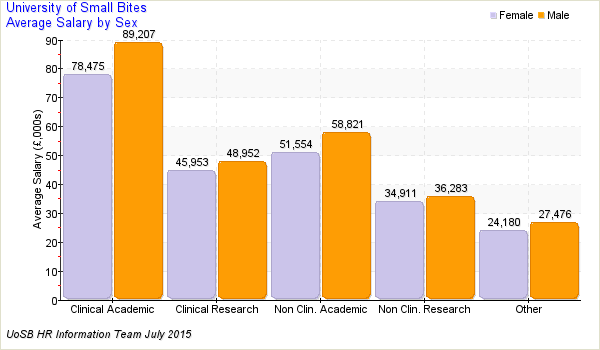
University of Small Bites
Average Salary by Sex Profile
| Staff Group | Sex | Count | Average Salary |
|---|---|---|---|
| Clinical Academic | Female | 17 | 78,475 |
| Clinical Academic | Male | 75 | 89,207 |
| Clinical Research | Female | 12 | 45,953 |
| Clinical Research | Male | 30 | 48,952 |
| Non Clin. Academic | Female | 257 | 51,554 |
| Non Clin. Academic | Male | 499 | 58,821 |
| Non Clin. Research | Female | 207 | 34,911 |
| Non Clin. Research | Male | 201 | 36,283 |
| Other | Female | 1546 | 24,180 |
| Other | Male | 1008 | 27,476 |
| sum | 3852 |
In programming random data into the fictitious University of Small Bites it is interesting to note that the organisational age distributon forms quite a reasonable bell shaped curve with the graph falling off reasonably on either side. This distribution at the organisational level is the same for both sexes. This is not necessariy the case when we look into some of the fictional faculties.
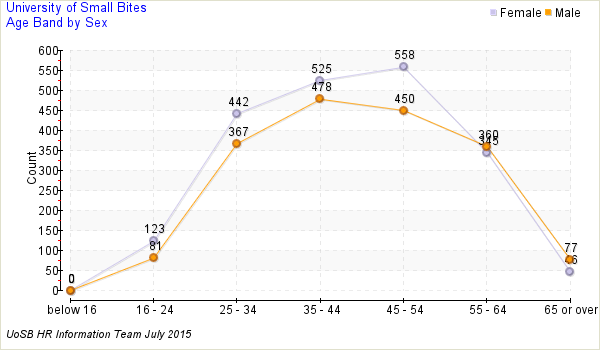
University of Small Bites
Age Band by Sex Profile
| Age Band | Sex | Count |
|---|---|---|
| below 16 | 0 | |
| 16 - 24 | Female | 123 |
| 16 - 24 | Male | 81 |
| 25 - 34 | Female | 442 |
| 25 - 34 | Male | 367 |
| 35 - 44 | Female | 525 |
| 35 - 44 | Male | 478 |
| 45 - 54 | Female | 558 |
| 45 - 54 | Male | 450 |
| 55 - 64 | Female | 345 |
| 55 - 64 | Male | 360 |
| 65 or over | Female | 46 |
| 65 or over | Male | 77 |
| sum | 3852 |
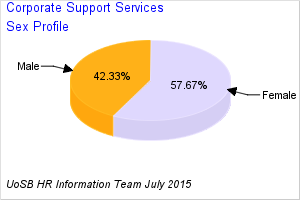
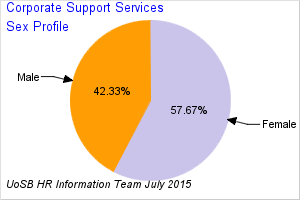
Corporate Support Services
Sex Profile
| Female | 925 | 57.67% |
| Male | 679 | 42.33% |
| Sum: | 1604 | 100% |
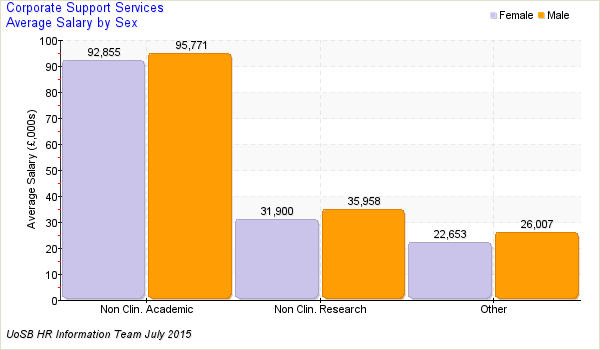
Corporate Support Services
Average Salary by Sex Profile
| Staff Group | Sex | Count | Average Salary |
|---|---|---|---|
| Non Clin. Academic | Female | 1 | 92,855 |
| Non Clin. Academic | Male | 3 | 95,771 |
| Non Clin. Research | Female | 2 | 31,900 |
| Non Clin. Research | Male | 2 | 35,958 |
| Other | Female | 922 | 22,653 |
| Other | Male | 674 | 26,007 |
| sum | 1604 |
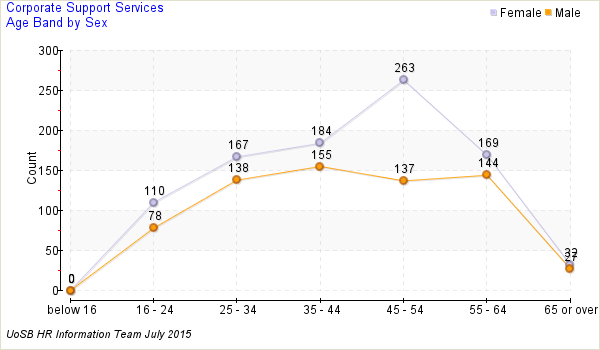
Corporate Support Services
Age Band by Sex Profile
| Age Band | Sex | Count |
|---|---|---|
| below 16 | 0 | |
| 16 - 24 | Female | 110 |
| 16 - 24 | Male | 78 |
| 25 - 34 | Female | 167 |
| 25 - 34 | Male | 138 |
| 35 - 44 | Female | 184 |
| 35 - 44 | Male | 155 |
| 45 - 54 | Female | 263 |
| 45 - 54 | Male | 137 |
| 55 - 64 | Female | 169 |
| 55 - 64 | Male | 144 |
| 65 or over | Female | 32 |
| 65 or over | Male | 27 |
| sum | 1604 |
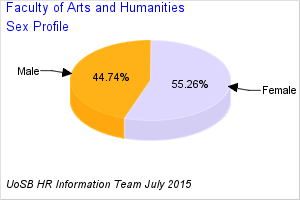
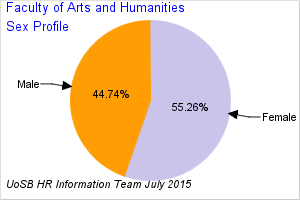
Faculty of Arts and Humanities
Sex Profile
| Female | 126 | 55.26% |
| Male | 102 | 44.74% |
| Sum: | 228 | 100% |
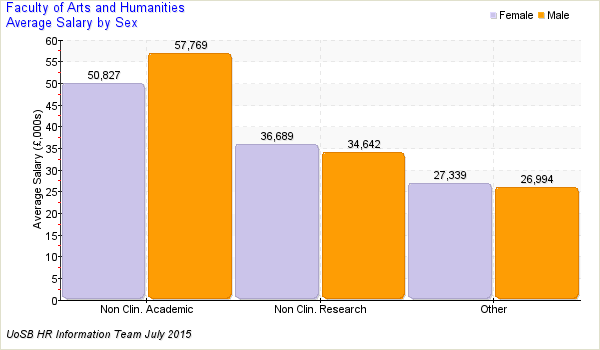
Faculty of Arts and Humanities
Average Salary by Sex Profile
| Staff Group | Sex | Count | Average Salary |
|---|---|---|---|
| Non Clin. Academic | Female | 57 | 50,827 |
| Non Clin. Academic | Male | 64 | 57,769 |
| Non Clin. Research | Female | 16 | 36,689 |
| Non Clin. Research | Male | 17 | 34,642 |
| Other | Female | 53 | 27,339 |
| Other | Male | 21 | 26,994 |
| sum | 228 |
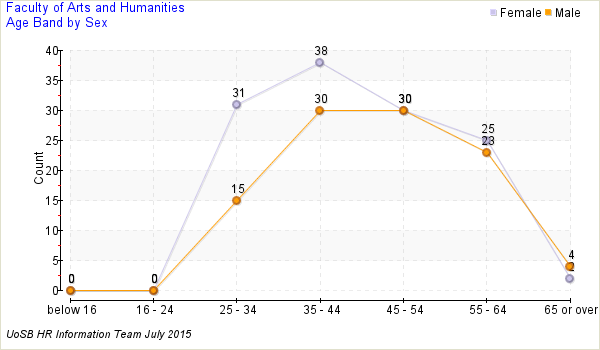
Faculty of Arts and Humanities
Age Band by Sex Profile
| Age Band | Sex | Count |
|---|---|---|
| below 16 | 0 | |
| 16 - 24 | 0 | |
| 25 - 34 | Female | 31 |
| 25 - 34 | Male | 15 |
| 35 - 44 | Female | 38 |
| 35 - 44 | Male | 30 |
| 45 - 54 | Female | 30 |
| 45 - 54 | Male | 30 |
| 55 - 64 | Female | 25 |
| 55 - 64 | Male | 23 |
| 65 or over | Female | 2 |
| 65 or over | Male | 4 |
| sum | 228 |
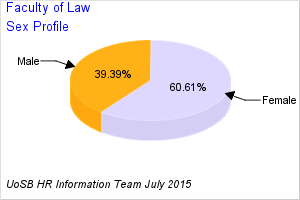
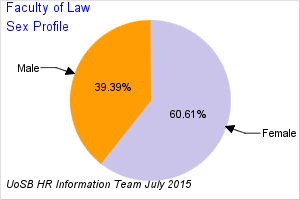
Faculty of Law
Sex Profile
| Female | 40 | 60.61% |
| Male | 26 | 39.39% |
| Sum: | 66 | 100% |
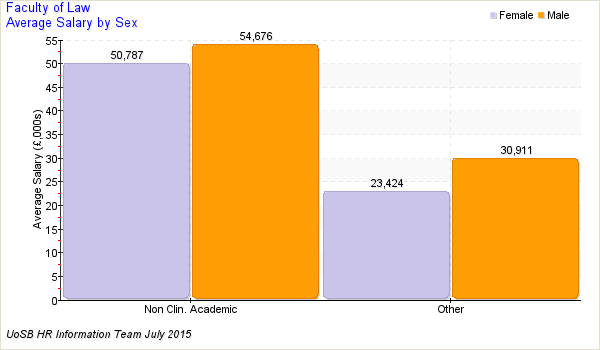
Faculty of Law
Average Salary by Sex Profile
| Staff Group | Sex | Count | Average Salary |
|---|---|---|---|
| Non Clin. Academic | Female | 26 | 50,787 |
| Non Clin. Academic | Male | 22 | 54,676 |
| Other | Female | 14 | 23,424 |
| Other | Male | 4 | 30,911 |
| sum | 66 |
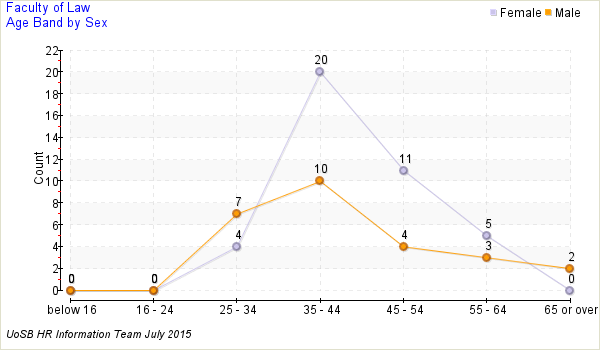
Faculty of Law
Age Band by Sex Profile
| Age Band | Sex | Count |
|---|---|---|
| below 16 | 0 | |
| 16 - 24 | 0 | |
| 25 - 34 | Female | 4 |
| 25 - 34 | Male | 7 |
| 35 - 44 | Female | 20 |
| 35 - 44 | Male | 10 |
| 45 - 54 | Female | 11 |
| 45 - 54 | Male | 4 |
| 55 - 64 | Female | 5 |
| 55 - 64 | Male | 3 |
| 65 or over | Male | 2 |
| sum | 66 |
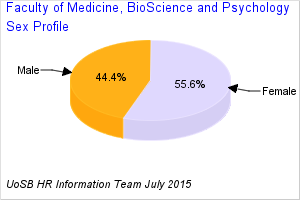
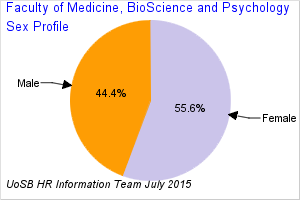
Faculty of Medicine, BioScience and Psychology
Sex Profile
| Female | 536 | 55.60% |
| Male | 428 | 44.40% |
| Sum: | 964 | 100% |
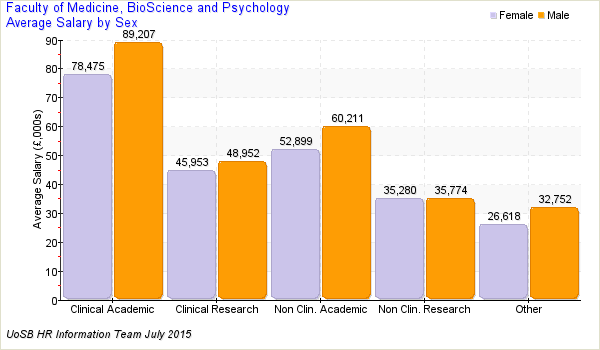
Faculty of Medicine, BioScience and Psychology
Average Salary by Sex Profile
| Staff Group | Sex | Count | Average Salary |
|---|---|---|---|
| Clinical Academic | Female | 17 | 78,475 |
| Clinical Academic | Male | 75 | 89,207 |
| Clinical Research | Female | 12 | 45,953 |
| Clinical Research | Male | 30 | 48,952 |
| Non Clin. Academic | Female | 60 | 52,899 |
| Non Clin. Academic | Male | 125 | 60,211 |
| Non Clin. Research | Female | 144 | 35,280 |
| Non Clin. Research | Male | 103 | 35,774 |
| Other | Female | 303 | 26,618 |
| Other | Male | 95 | 32,752 |
| sum | 964 |
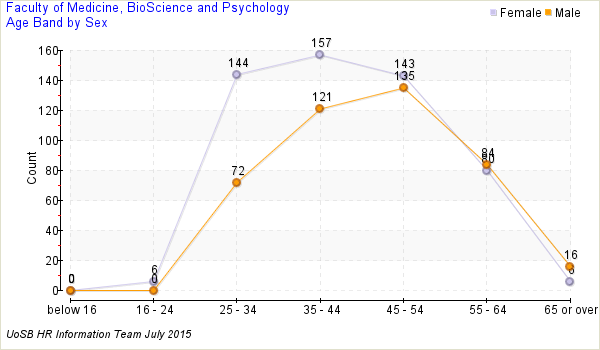
Faculty of Medicine, BioScience and Psychology
Age Band by Sex Profile
| Age Band | Sex | Count |
|---|---|---|
| below 16 | 0 | |
| 16 - 24 | Female | 6 |
| 25 - 34 | Female | 144 |
| 25 - 34 | Male | 72 |
| 35 - 44 | Female | 157 |
| 35 - 44 | Male | 121 |
| 45 - 54 | Female | 143 |
| 45 - 54 | Male | 135 |
| 55 - 64 | Female | 80 |
| 55 - 64 | Male | 84 |
| 65 or over | Female | 6 |
| 65 or over | Male | 16 |
| sum | 964 |
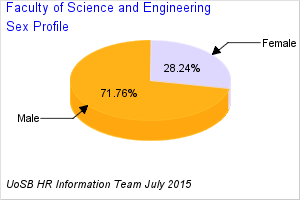
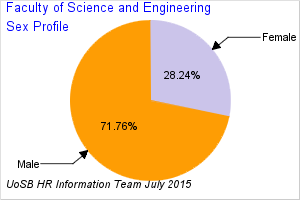
Faculty of Science and Engineering
Sex Profile
| Female | 146 | 28.24% |
| Male | 371 | 71.76% |
| Sum: | 517 | 100% |
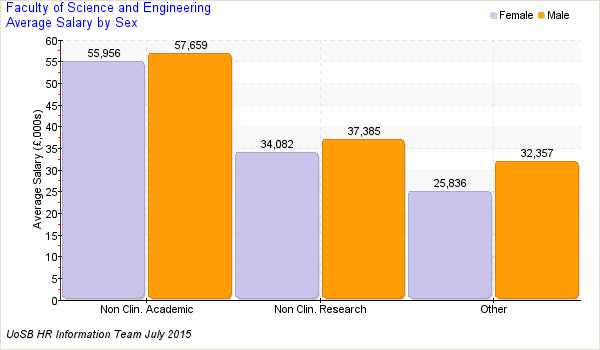
Faculty of Science and Engineering
Average Salary by Sex Profile
| Staff Group | Sex | Count | Average Salary |
|---|---|---|---|
| Non Clin. Academic | Female | 23 | 55,956 |
| Non Clin. Academic | Male | 160 | 57,659 |
| Non Clin. Research | Female | 38 | 34,082 |
| Non Clin. Research | Male | 76 | 37,385 |
| Other | Female | 85 | 25,836 |
| Other | Male | 135 | 32,357 |
| sum | 517 |
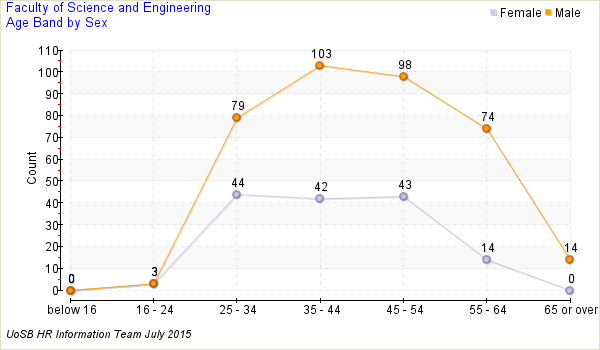
Faculty of Science and Engineering
Age Band by Sex Profile
| Age Band | Sex | Count |
|---|---|---|
| below 16 | 0 | |
| 16 - 24 | Female | 3 |
| 16 - 24 | Male | 3 |
| 25 - 34 | Female | 44 |
| 25 - 34 | Male | 79 |
| 35 - 44 | Female | 42 |
| 35 - 44 | Male | 103 |
| 45 - 54 | Female | 43 |
| 45 - 54 | Male | 98 |
| 55 - 64 | Female | 14 |
| 55 - 64 | Male | 74 |
| 65 or over | Male | 14 |
| sum | 517 |
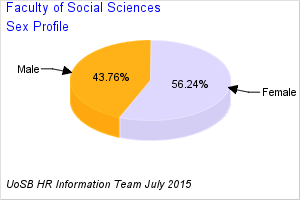
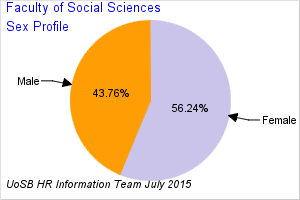
Faculty of Social Sciences
Sex Profile
| Female | 266 | 56.24% |
| Male | 207 | 43.76% |
| Sum: | 473 | 100% |
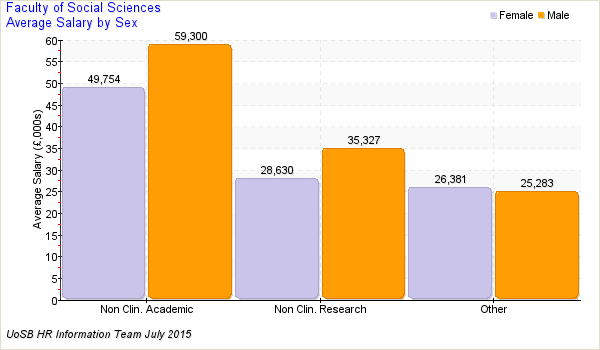
Faculty of Social Sciences
Average Salary by Sex Profile
| Staff Group | Sex | Count | Average Salary |
|---|---|---|---|
| Non Clin. Academic | Female | 90 | 49,754 |
| Non Clin. Academic | Male | 125 | 59,300 |
| Non Clin. Research | Female | 7 | 28,630 |
| Non Clin. Research | Male | 3 | 35,327 |
| Other | Female | 169 | 26,381 |
| Other | Male | 79 | 25,283 |
| sum | 473 |
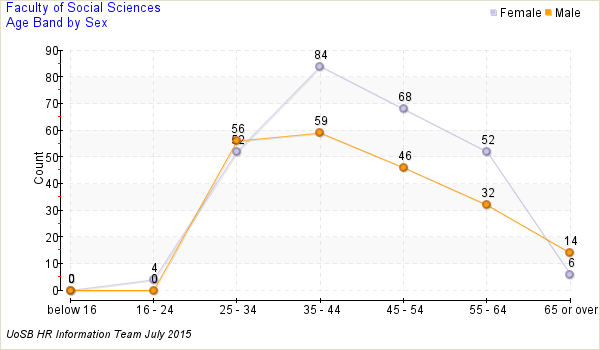
Faculty of Social Sciences
Age Band by Sex Profile
| Age Band | Sex | Count |
|---|---|---|
| below 16 | 0 | |
| 16 - 24 | Female | 4 |
| 25 - 34 | Female | 52 |
| 25 - 34 | Male | 56 |
| 35 - 44 | Female | 84 |
| 35 - 44 | Male | 59 |
| 45 - 54 | Female | 68 |
| 45 - 54 | Male | 46 |
| 55 - 64 | Female | 52 |
| 55 - 64 | Male | 32 |
| 65 or over | Female | 6 |
| 65 or over | Male | 14 |
| sum | 473 |